Hybrid RAG for Business Intelligence: Fusing Knowledge Graphs with Semantic Search
Have you ever asked an AI assistant a business question like “Which department drove the most revenue last quarter, and why?” and received a confidently worded answer that was completely made up? Standard Large Language Models are notorious for this, they generate fluent text, but they have no access to your actual corporate data, so they hallucinate numbers, invent trends, and fabricate relationships.
What if you could ground every answer in real data, not just documents, but the structured relationships between your employees, products, customers, and sales; all retrieved in real time and fused together before the LLM ever writes a single word?
In this post, we will unpack the concept of Retrieval-Augmented Generation (RAG), understand the strengths and weaknesses of its two dominant flavors (1) Vector RAG and (2) Graph RAG and walk through a reference project I built called Business Intelligence GraphRAG that combines them into a Hybrid RAG system.
What is RAG?
Retrieval-Augmented Generation is a pattern that bolts a retrieval step onto an LLM. Instead of relying solely on the model’s parametric memory (what it memorized during pre-training), RAG first searches a knowledge base for relevant context, injects that context into the prompt, and only then asks the LLM to generate an answer.
The three-step loop is simple:
- Retrieve: find relevant information from an external data source.
- Augment: pack that information into the LLM’s prompt as context.
- Generate: the LLM produces a grounded, data-driven answer.
Because the model is now citing real data rather than guessing, hallucinations drop dramatically. But the quality of the answer depends entirely on the quality of what you retrieve. And that is where Vector RAG and Graph RAG diverge.
Vector RAG: Semantic Search
Vector RAG is the most common RAG pattern. You take your documents i.e. reports, memos, briefs and split them into chunks, convert each chunk into a numerical embedding using a model like all-MiniLM-L6-v2, and store those embeddings in a vector database such as ChromaDB.
At query time, the user’s question is also embedded, and the vector store returns the top-K most semantically similar chunks.
Question: "How did the North America region perform?"

Embed query -> cosine similarity -> top-5 report chunks

"Q3 2024 quarterly report: North America saw a 12% increase..."
"Regional summary: North America accounts for 38% of total revenue..."
Strengths:
- Excellent at finding relevant passages from unstructured narrative text.
- Handles paraphrasing and synonym matching naturally (semantic, not keyword).
- Easy to set up, just chunk your docs, embed, search.
Weaknesses:
- No awareness of relationships. It cannot tell you that Alice manages the Sales department, which produced CloudSync Pro, which was purchased by Acme Corp.
- Retrieval is flat, every chunk is scored independently; there is no concept of traversing a connected structure.
- If the answer requires combining facts scattered across multiple entity types, vector search alone often returns only partial context.
Graph RAG: Structured Relationships
Graph RAG takes a fundamentally different approach. Instead of embedding flat text, it builds a knowledge graph, a network of entities (nodes) connected by typed relationships (edges).
For a corporate dataset, nodes might be Departments, Employees, Products, Customers, and Regions. Edges capture relationships like WORKS_IN, SOLD, PURCHASED, PRODUCED_BY, and LOCATED_IN.
At query time, Graph RAG extracts keywords from the question, matches them to graph nodes, and then traverses the neighborhood around those nodes to pull out a structured subgraph.
Question: "Which employees sold CloudSync Pro?"

Match "CloudSync Pro" -> Product node

Traverse SOLD edges -> Employee nodes

Structured context:
  - Alice [EMP-001] --[SOLD]--> CloudSync Pro (amount=$45K)
  - Bob   [EMP-007] --[SOLD]--> CloudSync Pro (amount=$32K)
Strengths:
- Multi-hop reasoning out of the box. “Who manages the department that produces our top product?” is a two-hop traversal, not a keyword search.
- Explicit, typed relationships - the model sees exactly how entities connect.
- Aggregation-friendly - you can count edges, sum amounts, and detect structural patterns before the LLM even sees the context.
Weaknesses:
- Knowledge graphs are only as good as their schema and extraction pipeline. They capture what you model, nothing more.
- They struggle with narrative nuance, a quarterly report paragraph saying “despite strong headwinds in APAC, the team exceeded targets” does not reduce neatly to nodes and edges.
- Building and maintaining the graph requires an ingestion pipeline and careful entity resolution.
The Problem: Why Neither Alone Is Enough
Consider this question: “Which department generates the most sales, and what do the quarterly reports say about its future outlook?”
- Graph-only can traverse
Department -> Employee -> SOLD -> Productedges, sum the amounts, and identify the top department. But it has zero visibility into the unstructured quarterly reports that discuss future outlook, market headwinds, or strategic pivots. - Vector-only can retrieve the most relevant quarterly report paragraphs mentioning “sales” and “outlook.” But it cannot reliably compute which department actually has the highest revenue, it would have to hope that a single report chunk happens to contain that exact ranking.
Neither retrieval mode alone gives the LLM enough context to answer both halves of the question. You need both and that is exactly what Hybrid RAG delivers.
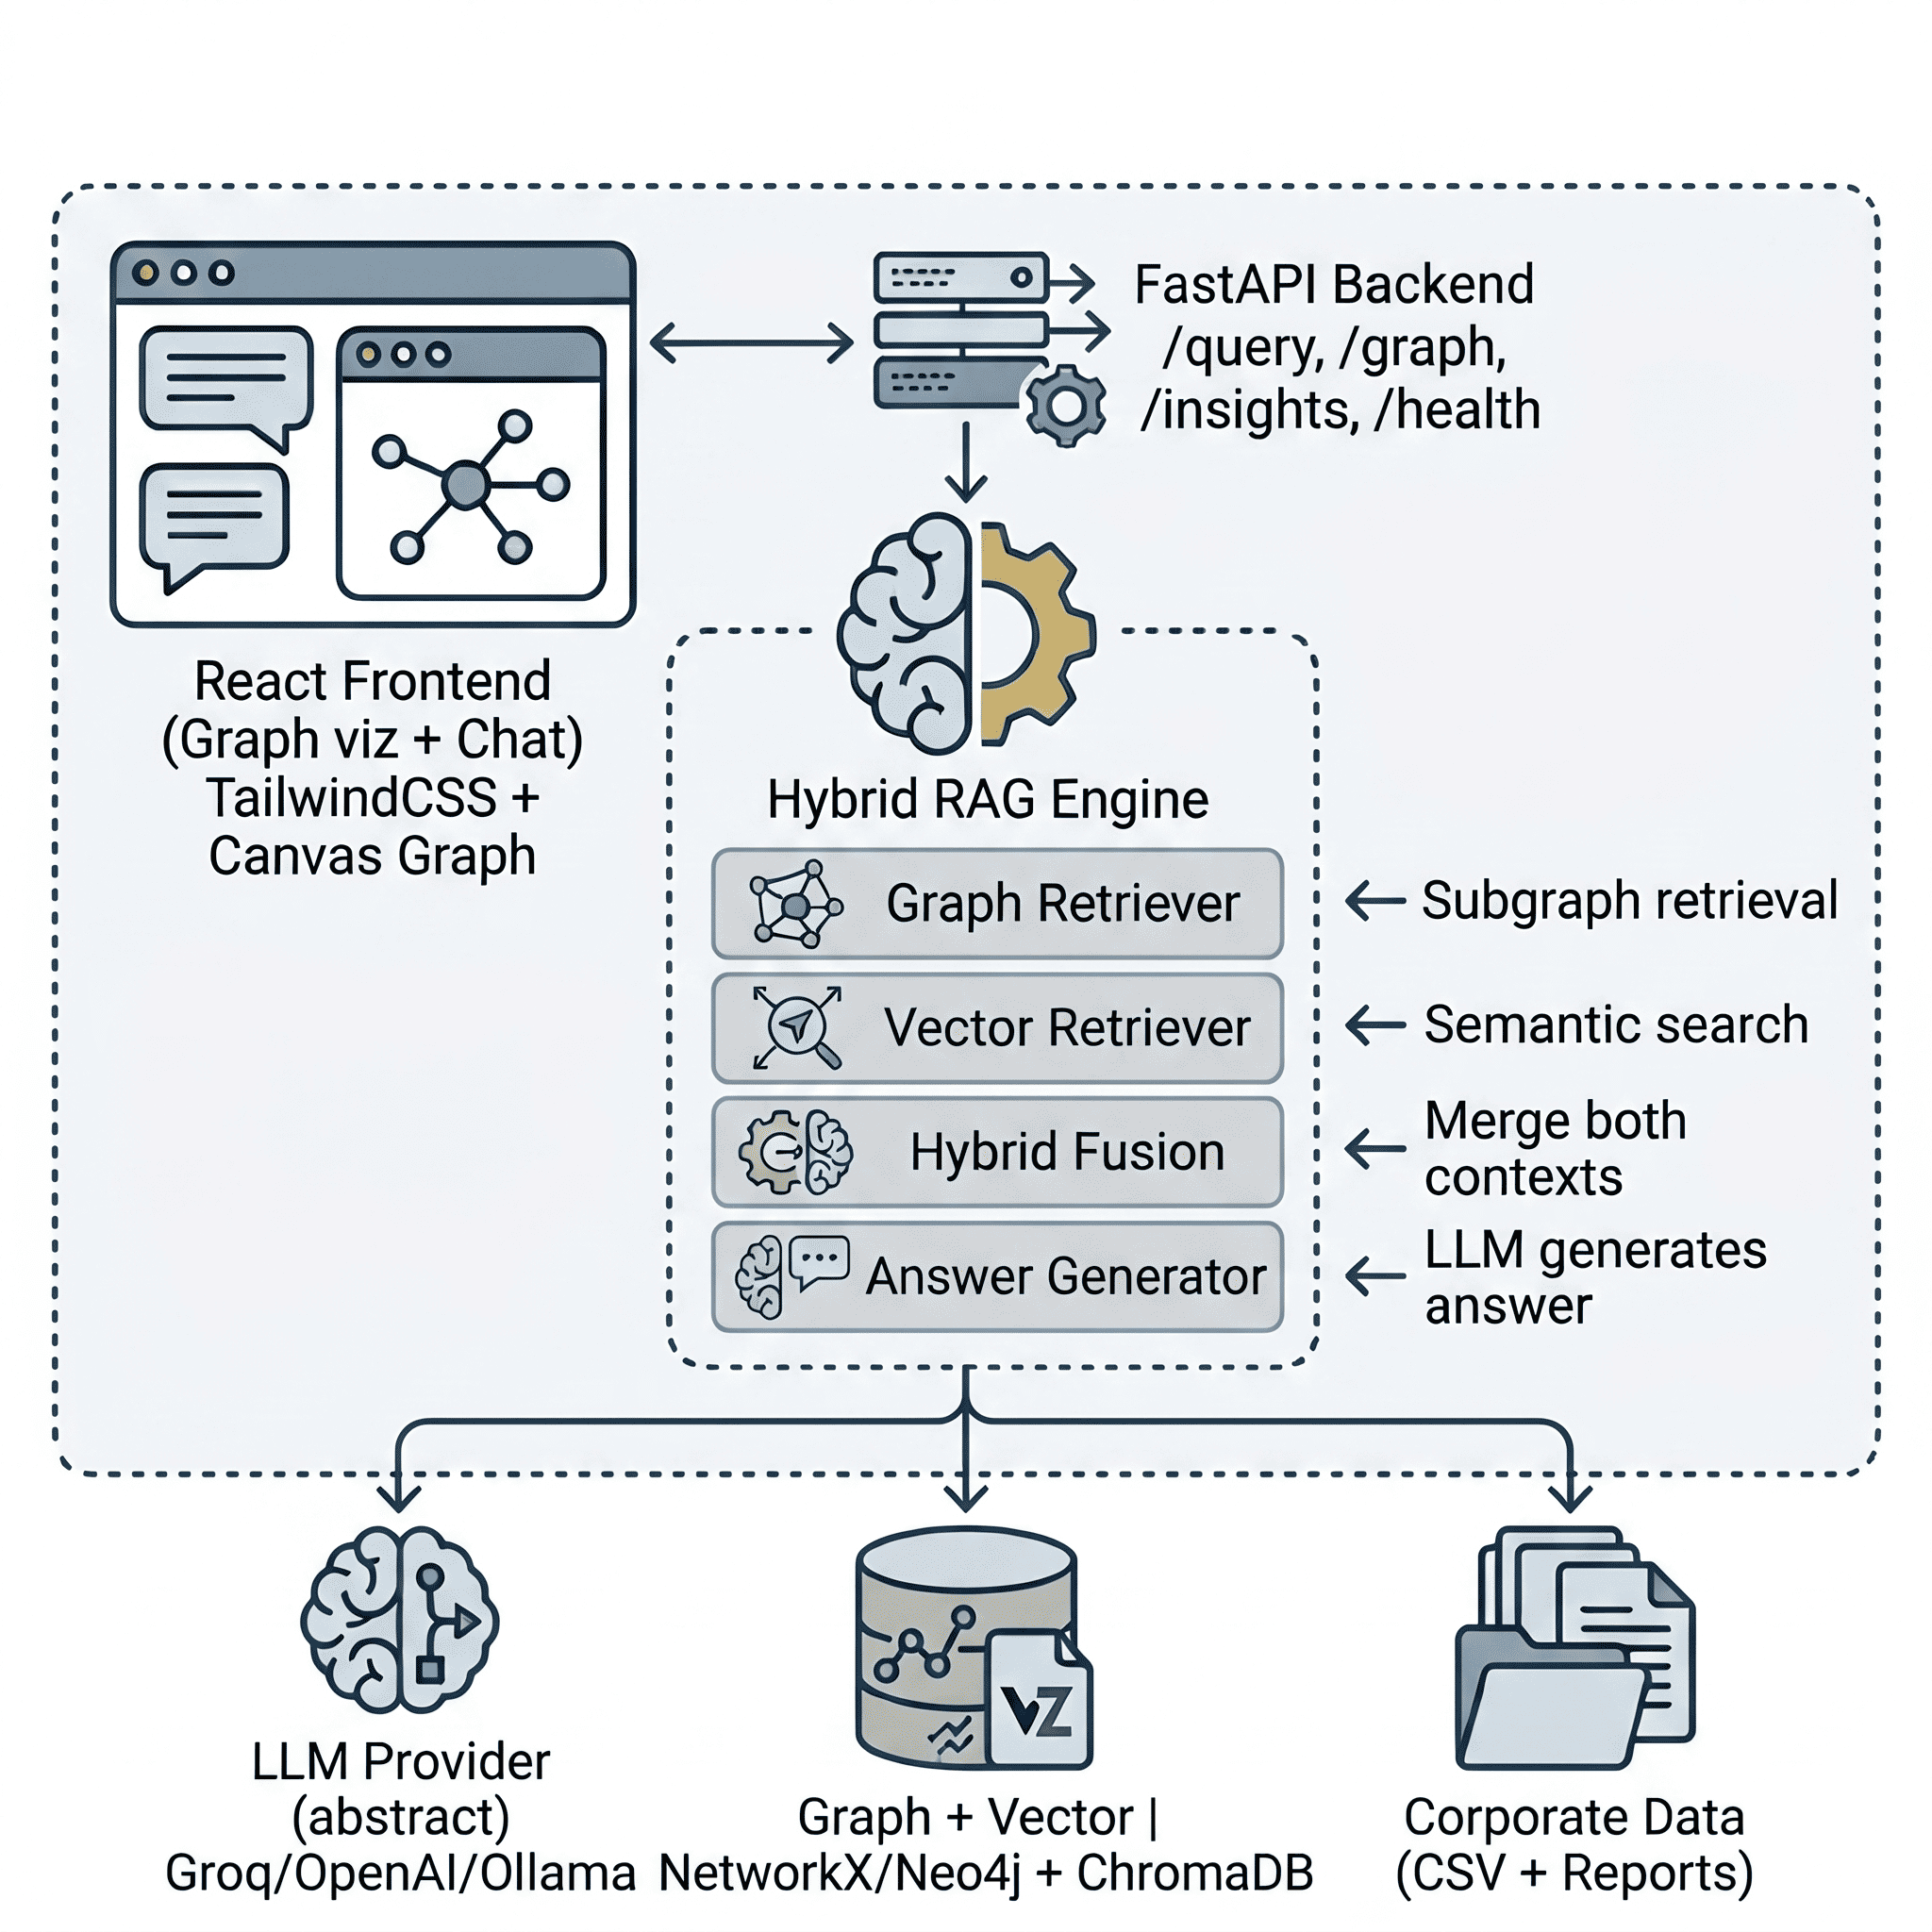
The Project: Business Intelligence GraphRAG
I built the Business Intelligence GraphRAG project to demonstrate this fusion in a production-style application. It ingests corporate data (sales transactions, employees, departments, products, customers, and business reports), builds both a knowledge graph and a vector store, and answers natural language BI questions by combining both retrieval paths.
1. Ingesting Corporate Data
The project ships with a synthetic data generator that creates a realistic corporate dataset: 6 departments, 8 products, 60 employees, 80 customers, 500 sales transactions spanning 2024–2025, and ~36 business report text files (quarterly reports, department memos, product briefs, regional summaries, customer case studies, and annual reviews).
The ingestion pipeline has two parallel paths:
Structured path (Graph): CSV files are loaded with Pandas, and a deterministic EntityExtractor walks through each table, creating typed entities and relationships without any LLM involvement. For example, a single sales transaction row produces three relationships:
# Employee sold Product
{"source": "EMP-042", "target": "PROD-003", "relation": "SOLD",
 "properties": {"amount": 4500.00, "date": "2025-07-15"}}

# Customer purchased Product
{"source": "CUST-018", "target": "PROD-003", "relation": "PURCHASED",
 "properties": {"amount": 4500.00, "quantity": 3}}

# Product sold in Quarter
{"source": "PROD-003", "target": "QTR-Q3-2025", "relation": "SOLD_IN",
 "properties": {"amount": 4500.00}}
All entities and relationships are loaded into a NetworkX directed graph (or optionally Neo4j) and persisted to disk.
Unstructured path (Vector): The generated business reports are read by a DocumentChunker that splits each text file into overlapping 500-character chunks (with 100-character overlap to preserve context across boundaries). These chunks are then embedded using all-MiniLM-L6-v2 and stored in a ChromaDB collection configured with cosine similarity.
2. The Hybrid Retriever (The Secret Sauce)
The core magic lives in the HybridRetriever class. When a query comes in, it fires both retrieval engines in parallel and fuses their outputs:
# Conceptual flow inside HybridRetriever.retrieve()

# Graph path: keywords → match nodes → traverse subgraph → structured context
graph_subgraph = graph_retriever.retrieve(query, max_depth=2)
graph_context  = context_builder.build(graph_subgraph)

# Vector path: embed query → top-K similar chunks → semantic context
vector_result  = vector_retriever.retrieve(query, top_k=5)
vector_context = vector_retriever.format_context(vector_result)

# Fuse both contexts
combined_context = f"{graph_context}\n\n{vector_context}"
The graph retriever extracts meaningful search terms from the query (filtering out stop words), matches them against graph nodes, and performs a breadth-first traversal up to max_depth hops to pull in the surrounding neighborhood. The ContextBuilder then serializes this subgraph into structured text — entities grouped by type, relationships grouped by relation — that the LLM can reason over.
The vector retriever embeds the raw query and retrieves the top-K most similar report chunks from ChromaDB, formatting them with source metadata and relevance scores.
The fused context looks like this inside the LLM’s prompt:
=== KNOWLEDGE GRAPH CONTEXT ===
## Entities
### Departments (3)
  - Sales [DEPT-001] budget=500000
  - Engineering [DEPT-002] budget=750000
  ...
## Relationships
### SOLD (45 connections)
  - Alice --[SOLD]--> CloudSync Pro (amount=45000)
  ...
=== END CONTEXT ===

=== DOCUMENT CONTEXT (from business reports) ===
--- [quarterly_report] quarterly_report_q3_2025.txt (relevance: 0.87) ---
Q3 2025 saw record-breaking revenue driven primarily by CloudSync Pro
adoption in the North America region...
=== END DOCUMENT CONTEXT ===
The system supports three retrieval modes, configurable per-request:
| Mode | Graph | Vector | Best for |
|---|---|---|---|
hybrid (default) |
✅ | ✅ | Richest answers: structured + semantic context |
graph_only |
✅ | ❌ | Fast, relationship-focused queries |
vector_only |
❌ | ✅ | Narrative/report-focused queries |
3. Answering Questions via API
The AnswerGenerator class orchestrates the full pipeline: query -> hybrid retrieve -> augment prompt -> LLM generate. It is exposed through a FastAPI POST /api/query endpoint:
curl -X POST http://localhost:8000/api/query \
  -H "Content-Type: application/json" \
  -d '{"query": "What are the top-selling products by revenue?"}'
The response includes the answer, subgraph metadata, vector chunks used, and a context preview:
{
  "query": "What are the top-selling products by revenue?",
  "answer": "Based on the knowledge graph and business reports...",
  "subgraph": {
    "node_count": 60,
    "edge_count": 138,
    "matched_terms": ["top-selling", "products", "revenue"]
  },
  "vector_chunks_used": 5,
  "retrieval_mode": "hybrid",
  "context_preview": "=== KNOWLEDGE GRAPH CONTEXT === ..."
}
Because the LLM’s system prompt instructs it to base answers only on the provided context and cite specific entities and data points, the responses are grounded, auditable, and far less prone to hallucination.
The Frontend: Graph Visualization + Chat
The project includes a React 18 + TailwindCSS frontend with three panels:
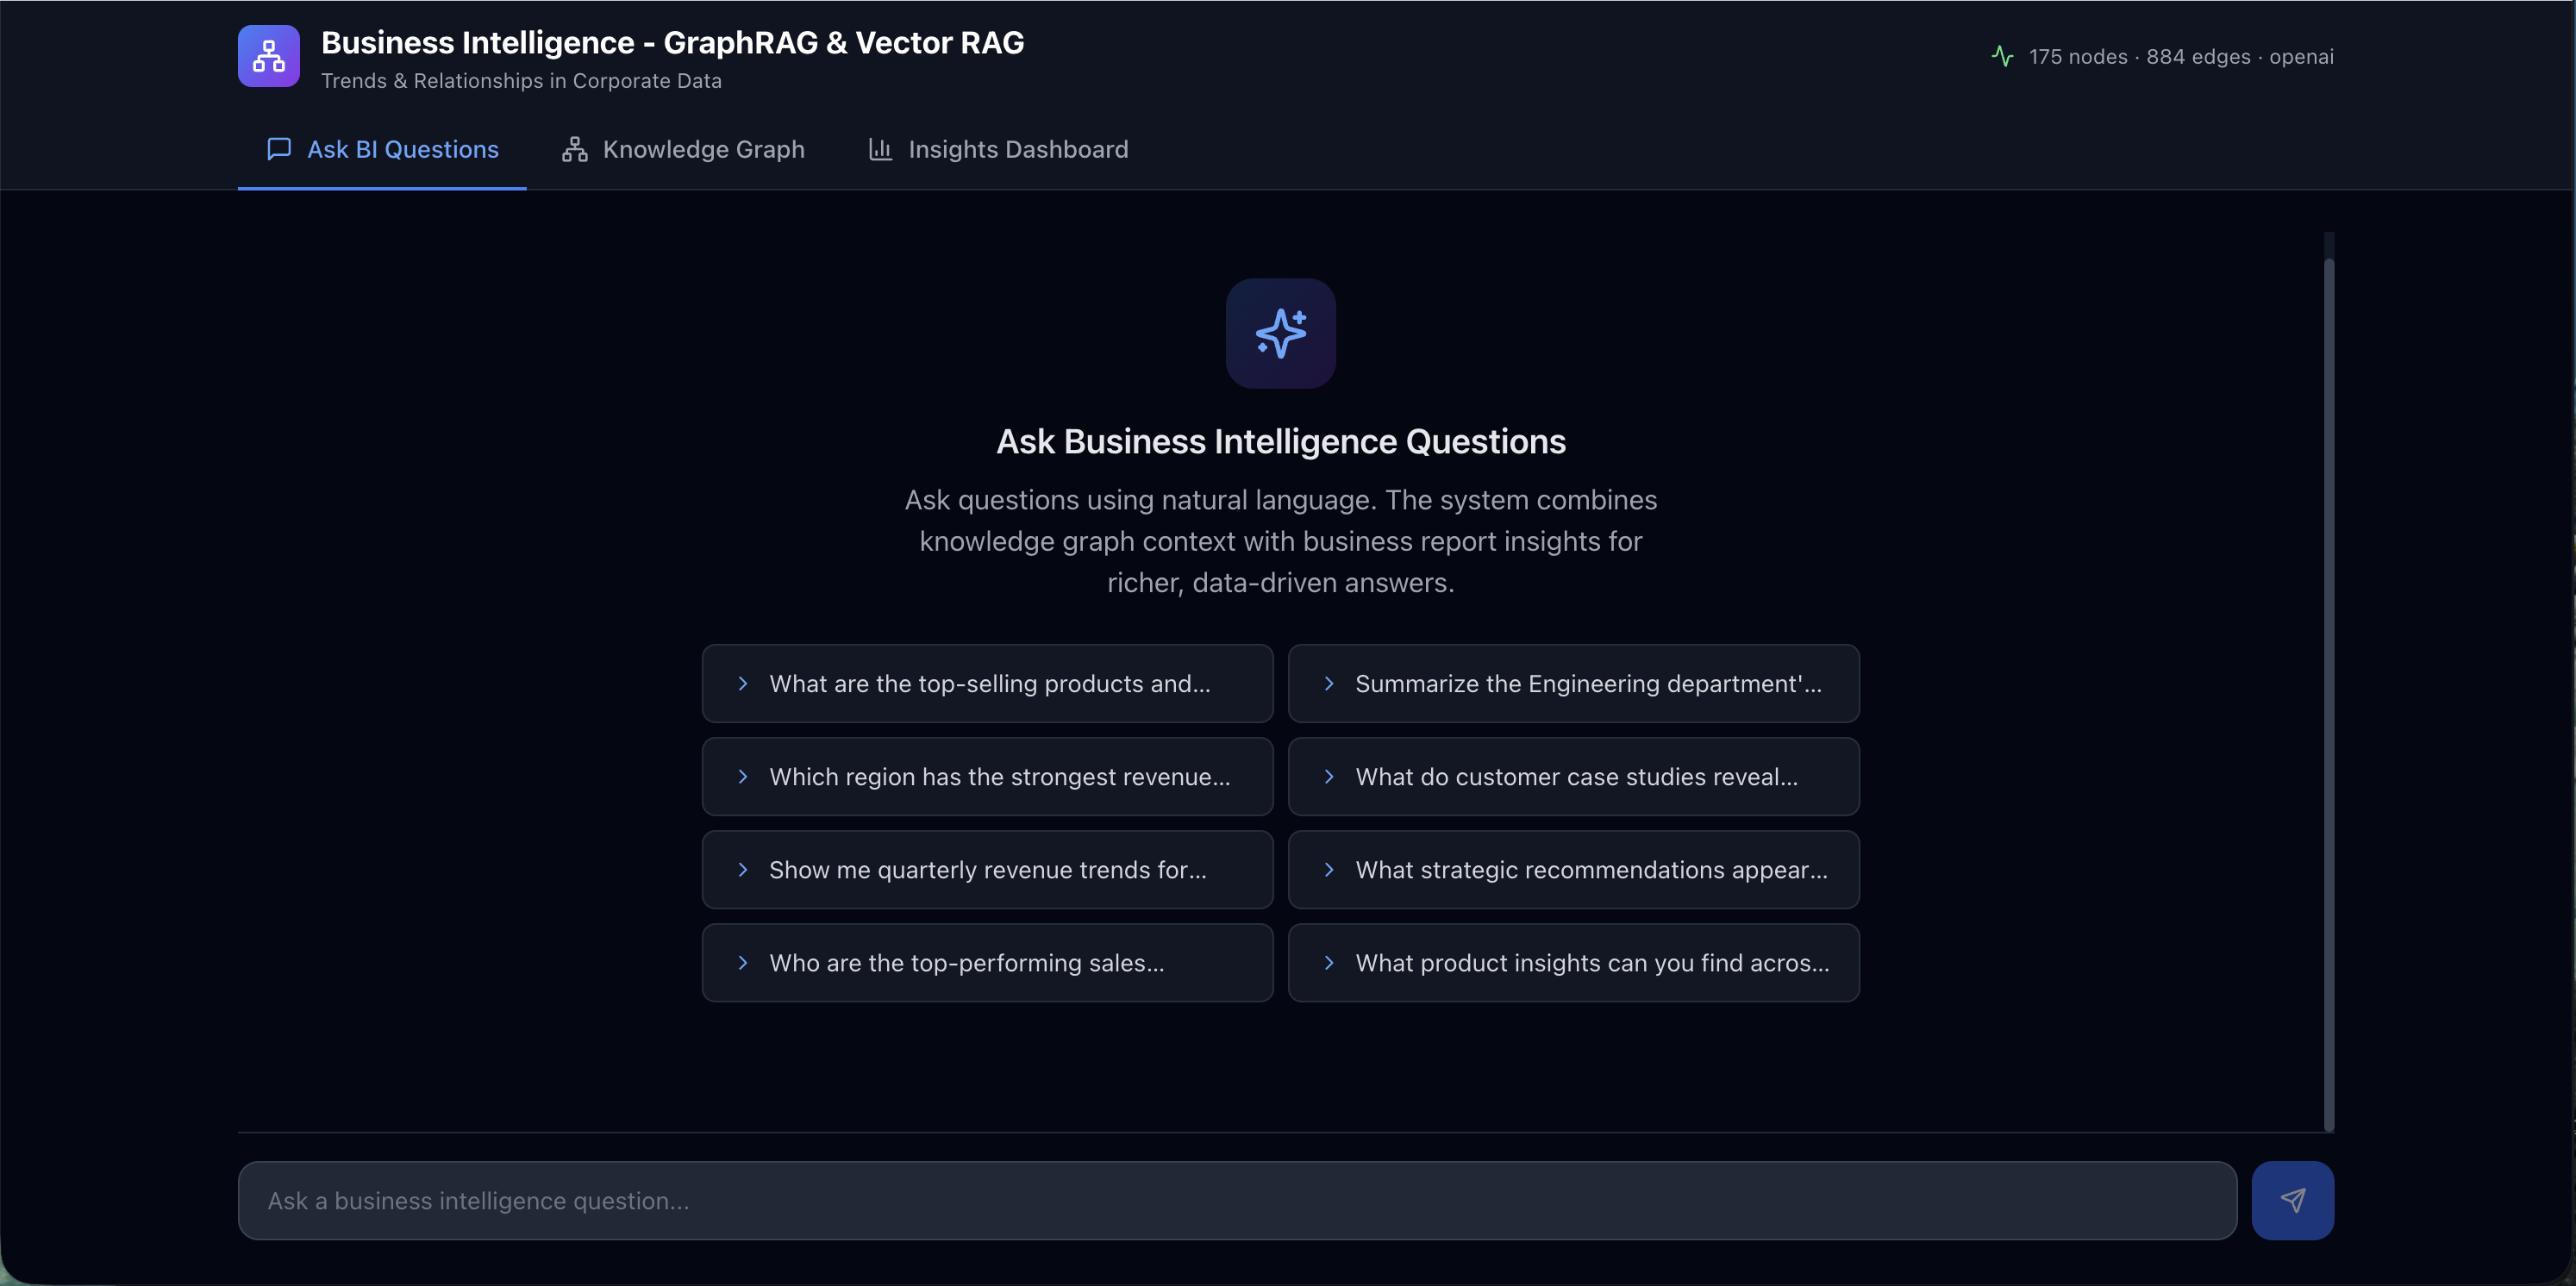
- ChatPanel: a natural language query interface where you type BI questions and receive data-driven answers.
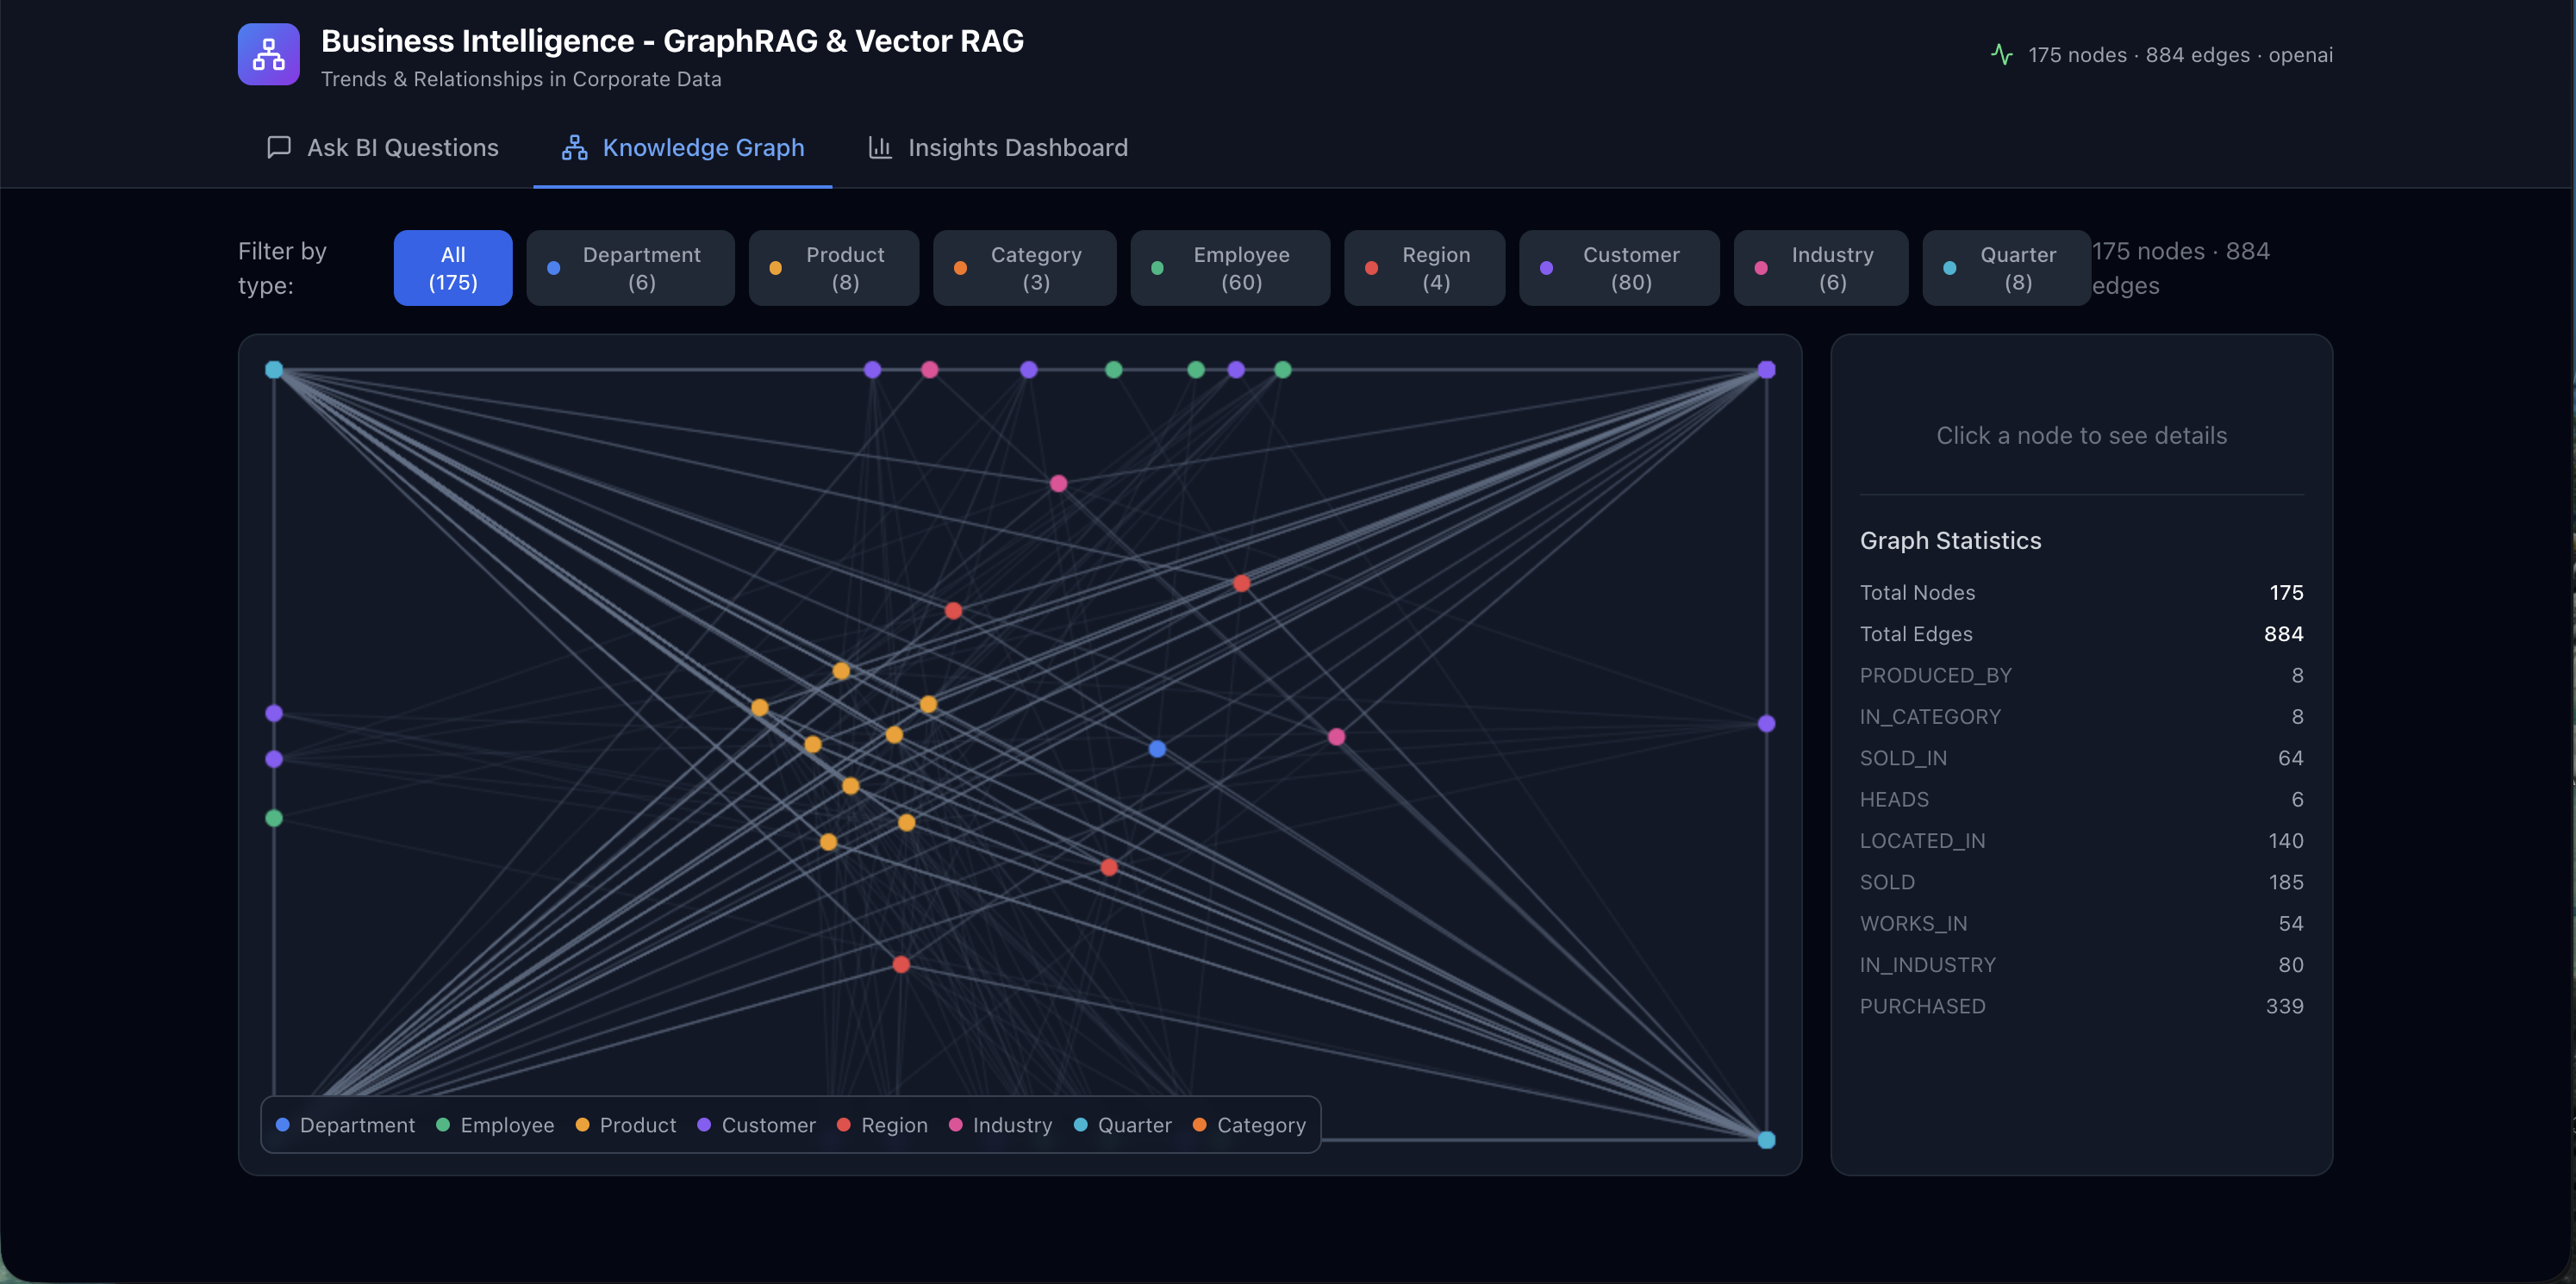
- GraphView: an interactive canvas-based graph visualization that renders the knowledge graph nodes and edges, letting you visually explore how entities connect.
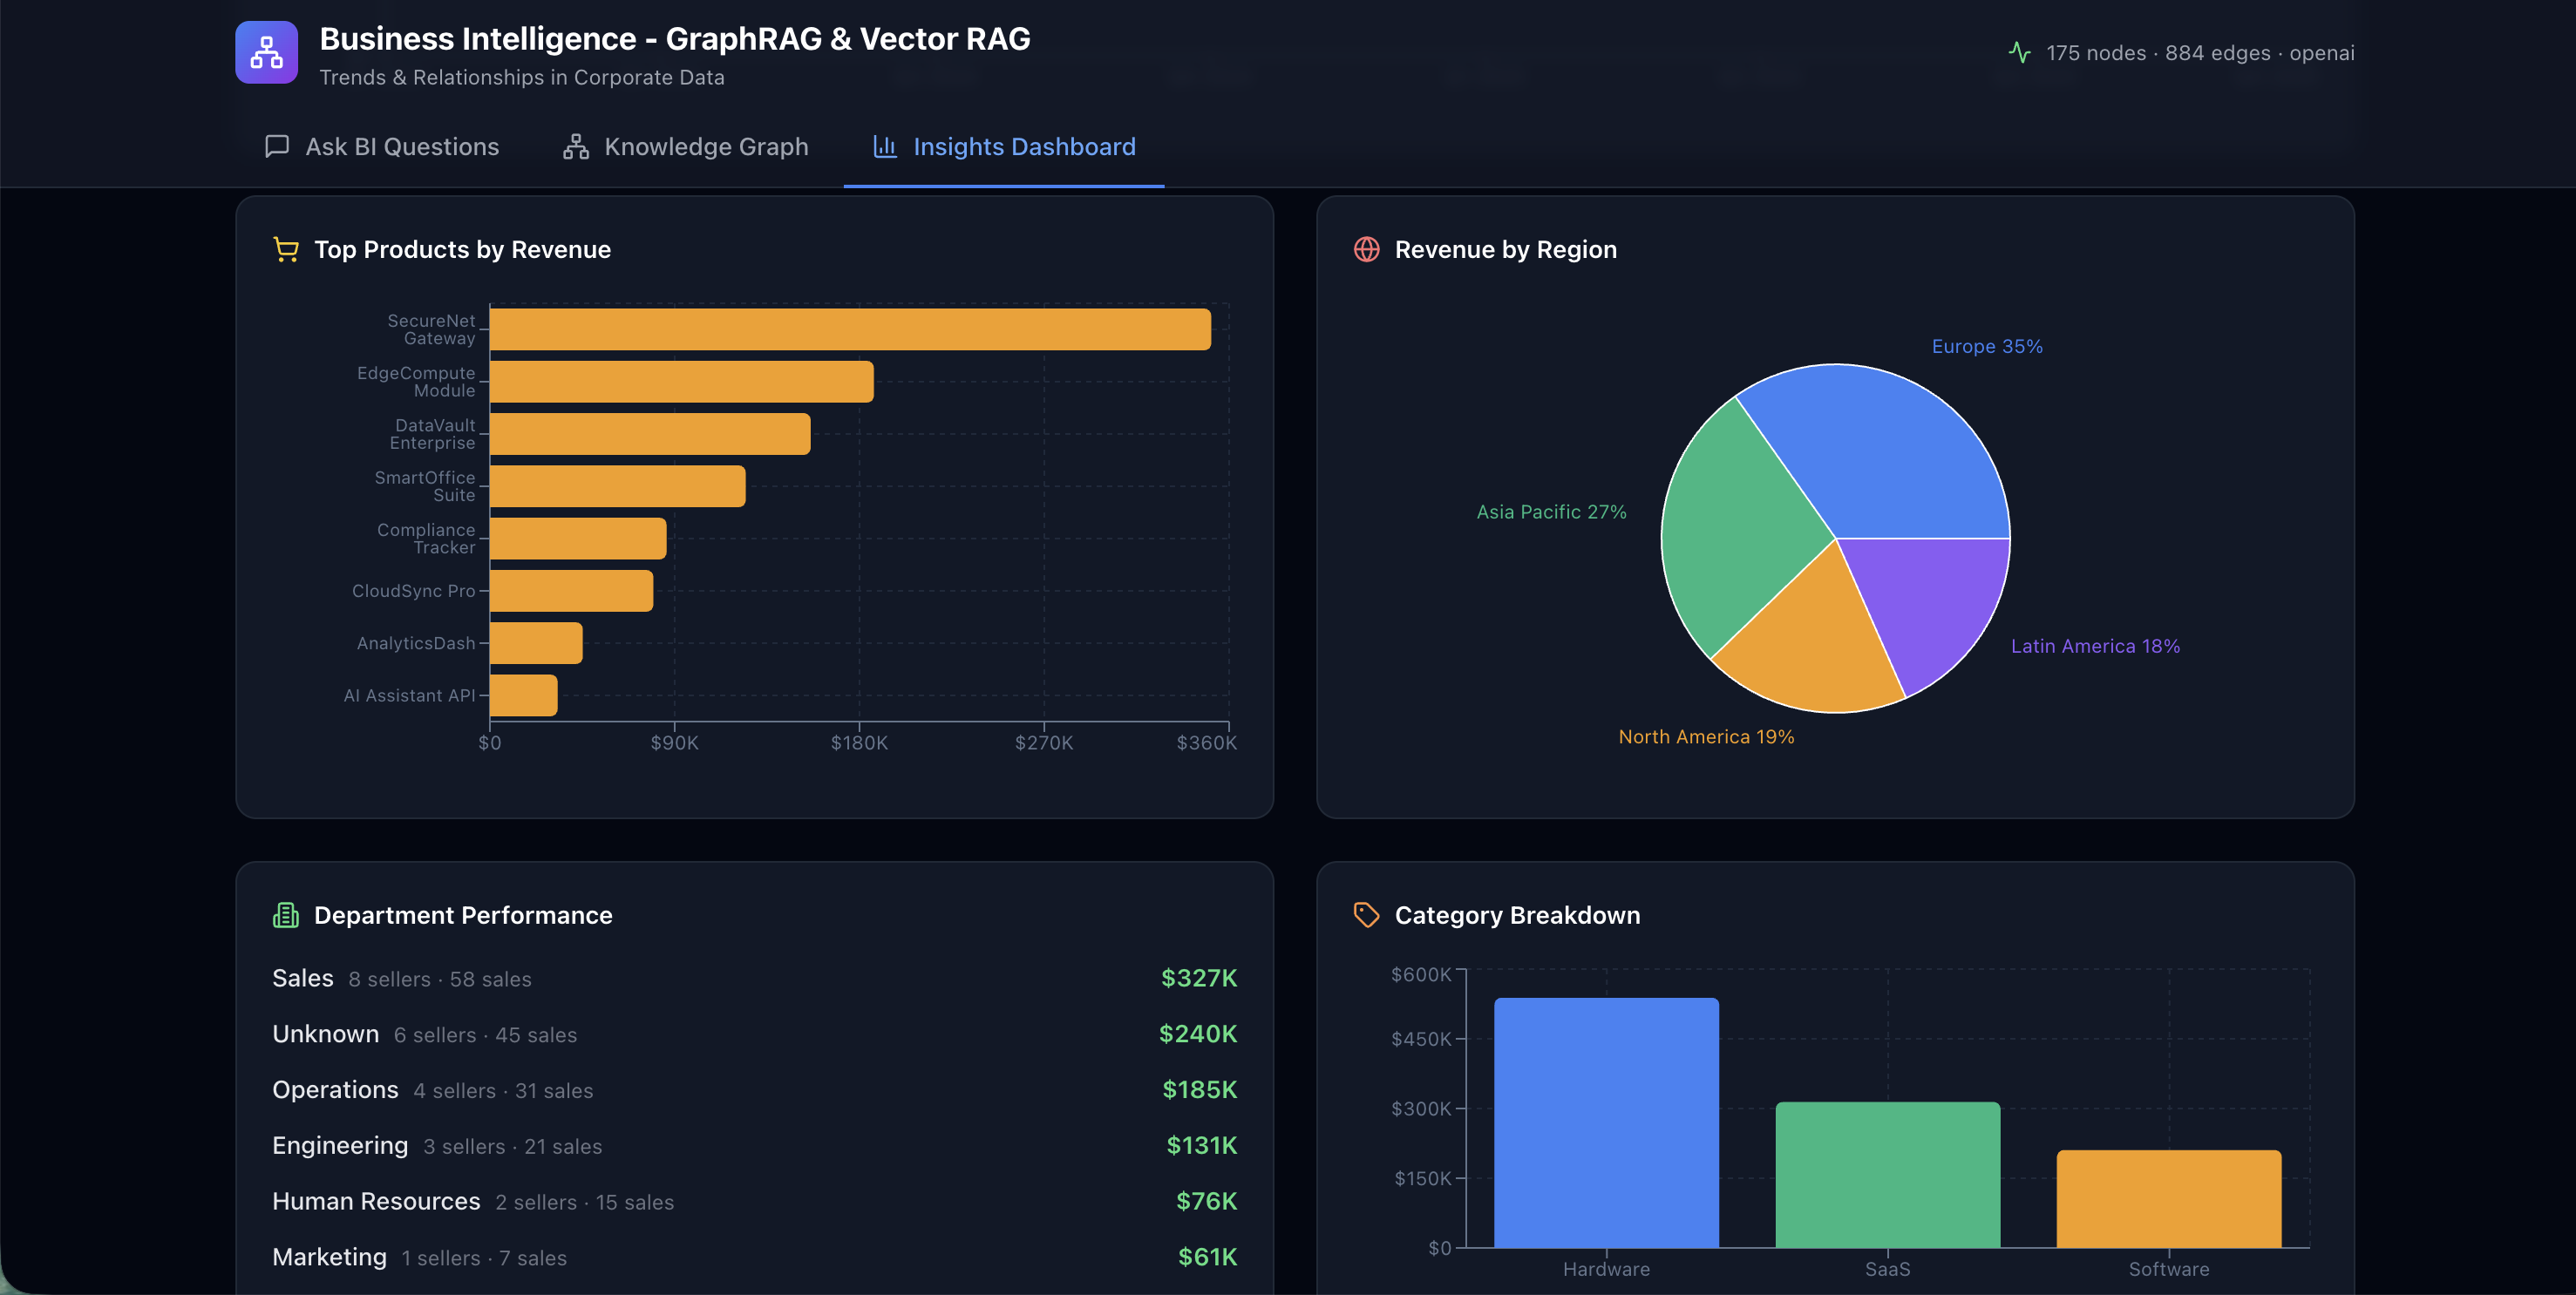
- InsightsPanel: pre-computed charts and dashboards (quarterly revenue trends, top products, department performance, regional distribution) powered by Recharts.
The ChatPanel comes with a set of pre-defined prompt suggestions covering common BI questions. Users can click any suggestion to instantly fire off a query without typing, making it easy to explore the dataset and understand the kinds of questions the Hybrid RAG system can answer.
The GraphView renders the full knowledge graph as an interactive, force-directed canvas. Nodes are color-coded by entity type (departments, employees, products, customers, regions) and edges display their relationship labels, giving you an immediate visual sense of how your corporate data is interconnected.
The InsightsPanel surfaces key business intelligence metrics through a series of charts and dashboards. Quarterly revenue trends, top-selling products, department-wise performance comparisons, and regional distribution breakdowns are all pre-computed and rendered with Recharts, providing at-a-glance analytics alongside the conversational interface.
Conclusion
By combining the structural precision of a knowledge graph with the semantic flexibility of vector search, Hybrid RAG produces answers that are both factually grounded and narratively rich. The graph path ensures the LLM sees explicit relationships, who sold what, which department produced which product, where customers are located. The vector path ensures the LLM also sees the qualitative analysis, the quarterly reports, strategic memos, and case studies that provide context no structured schema can capture.
I highly recommend cloning the Business Intelligence GraphRAG repository and experimenting with your own corporate datasets. Swap in Neo4j for persistent graph storage, point it at your own CSV exports, or wire up Ollama for a fully local, private BI assistant.
Please let me know if you liked this post or if you have any questions in the comments below!